Market Commentary: S&P 500 4,200 Next?
Last Friday a crack in the markets occurred in the final 30 minutes of trading. Although the session had largely been positive as volatility was crushed early on, selling accelerated into the close. It’s always an ominous sign for the markets when the close heading into the weekend is weak.
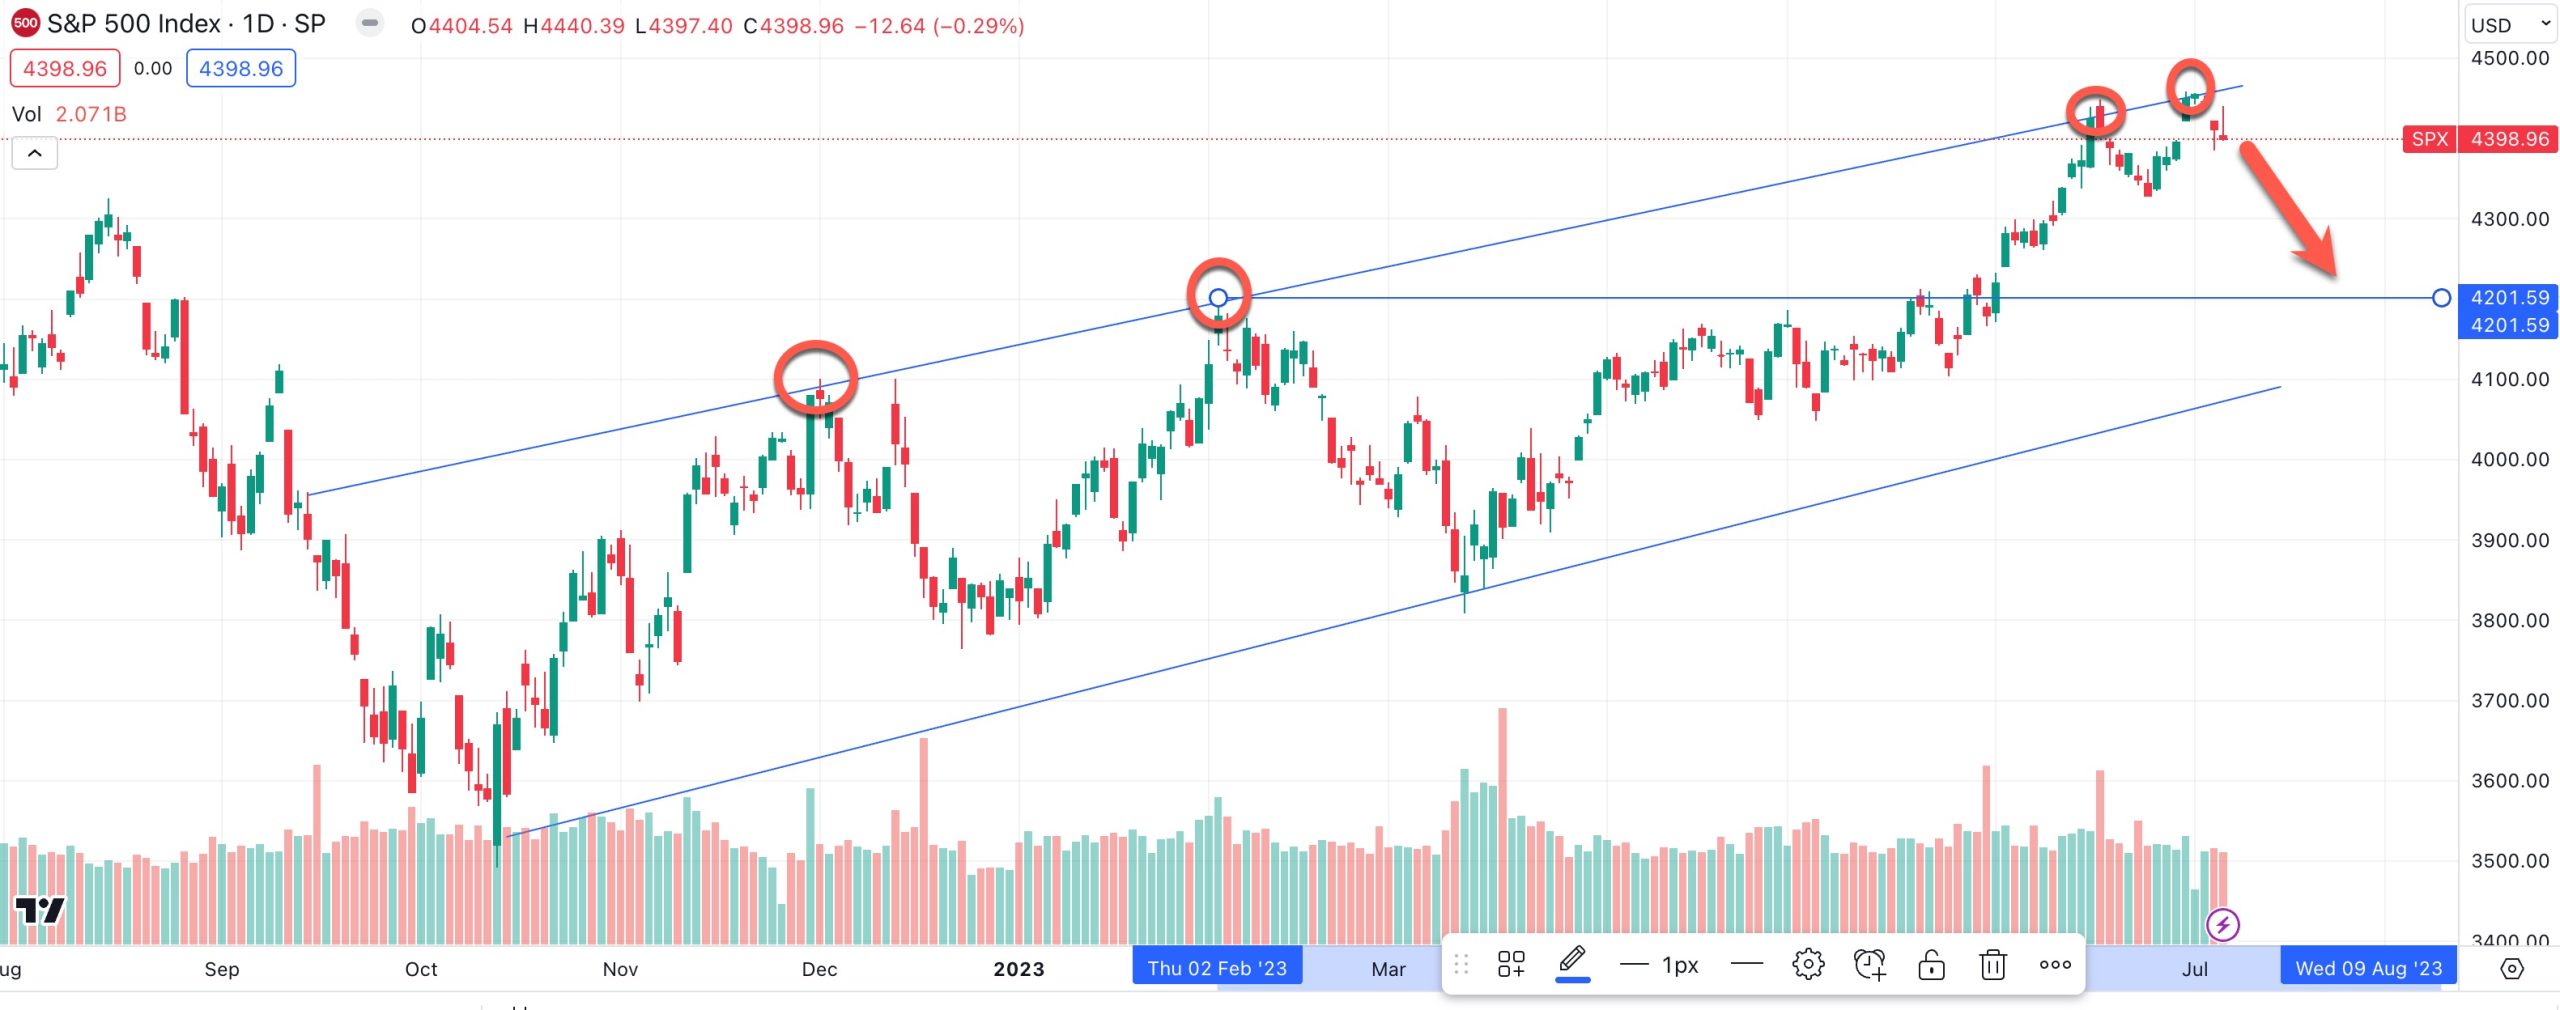
A closer look at the long-term trend reveals where the ceiling for the market lies. Each time the S&P 500 has touched its uptrending resistance line, sellers have taken control. Currently, that resistance point sits at 4,460. In the last few weeks that has held firm and the market has ambled lower. Each touch of resistance has been met with sellers, but to-date they haven’t asserted too much control.
Nevertheless, it’s clear that should the market gap down and start to trend lower the next stop could be 4,200 and failing support taking hold there it’s possible the market could crumble all the way back to 4,082.
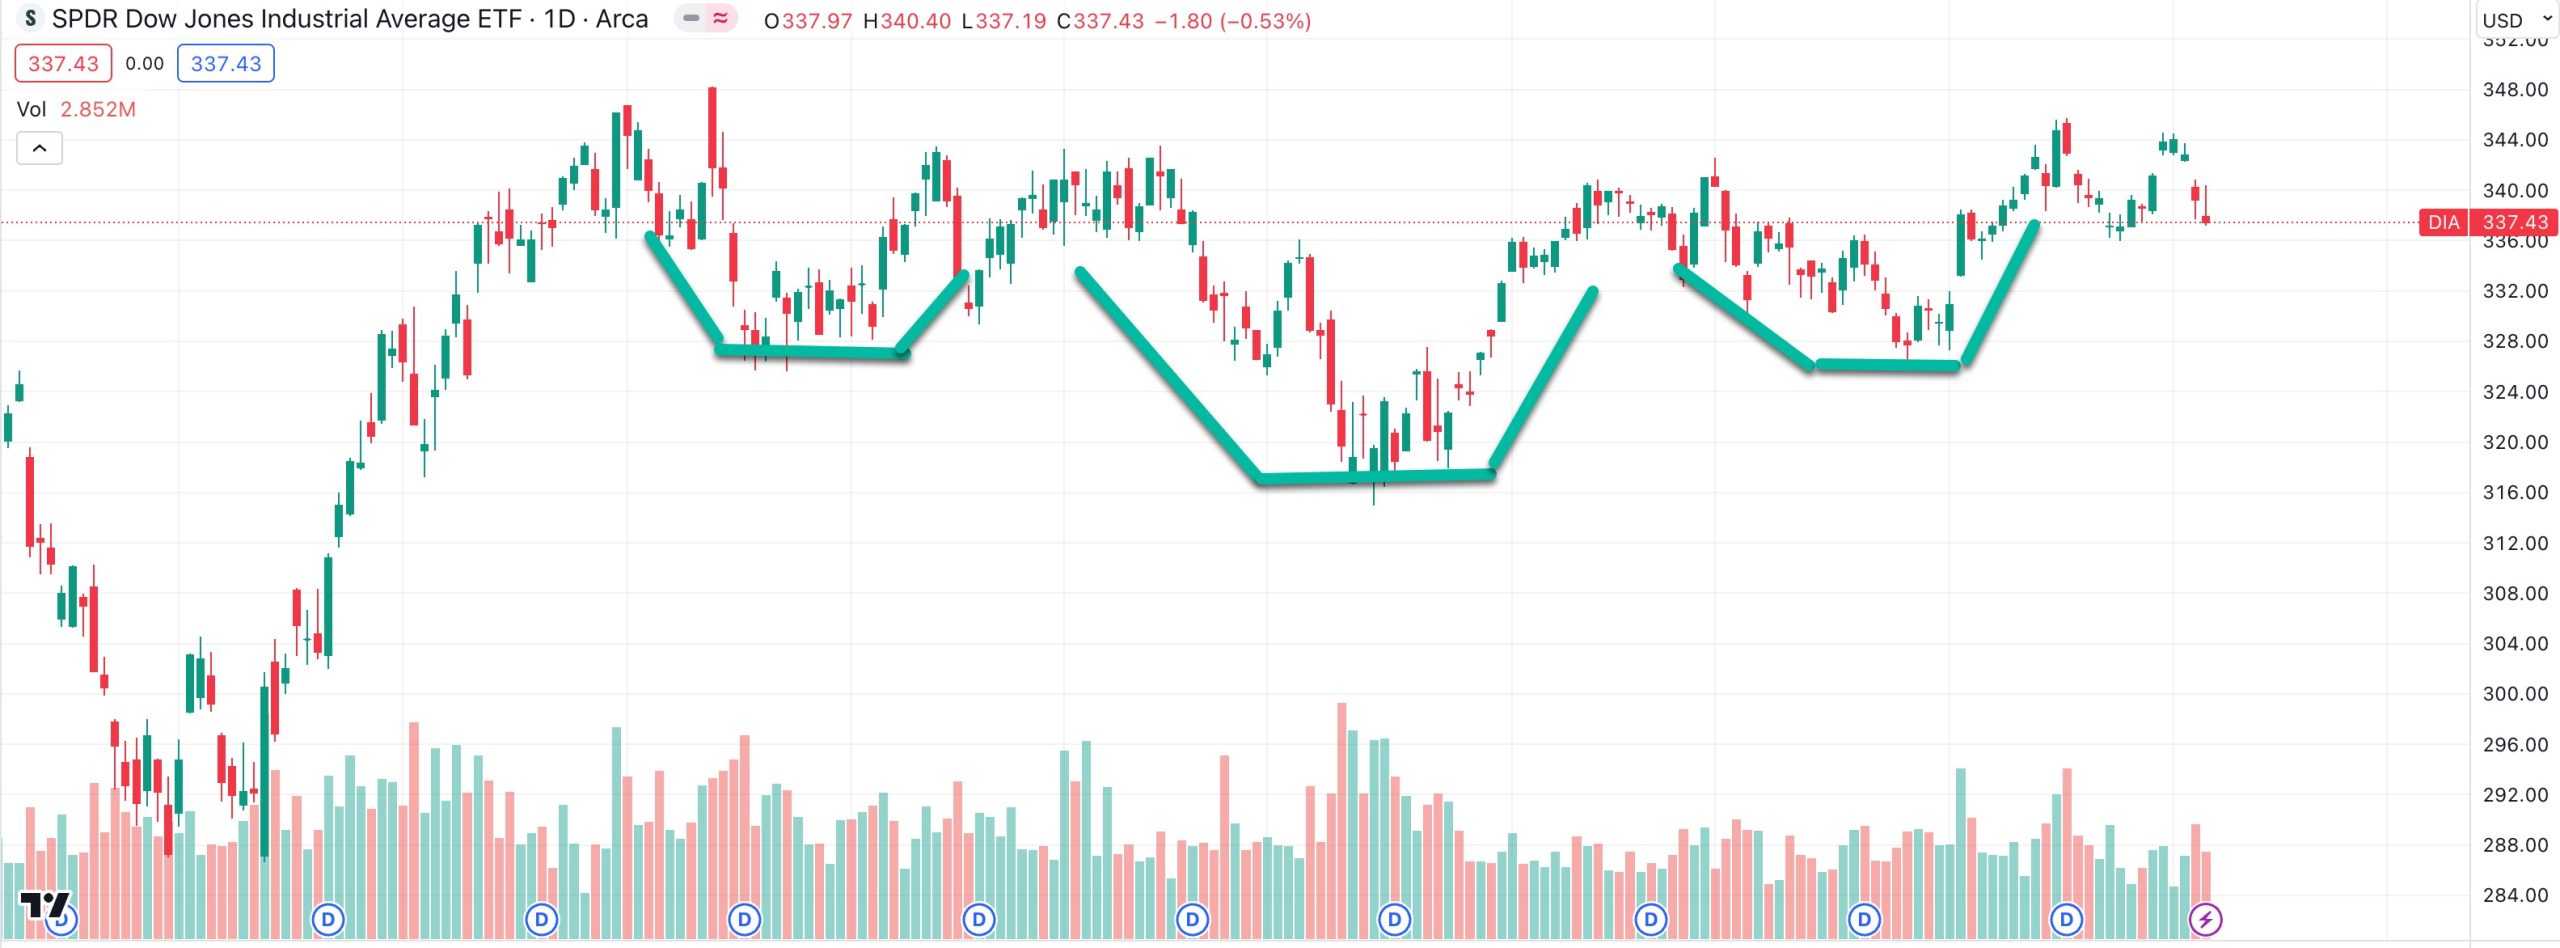
The Dow Jones Industrial Average is also looking vulnerable than the S&P 500, with a potential inverted head and shoulders pattern failing to break to the upside, so far.
So how do you play the market if it’s showing signs of weakness? One place to begin is stocks that have underperformed the rally and may enjoy capital flows from sector rotation.
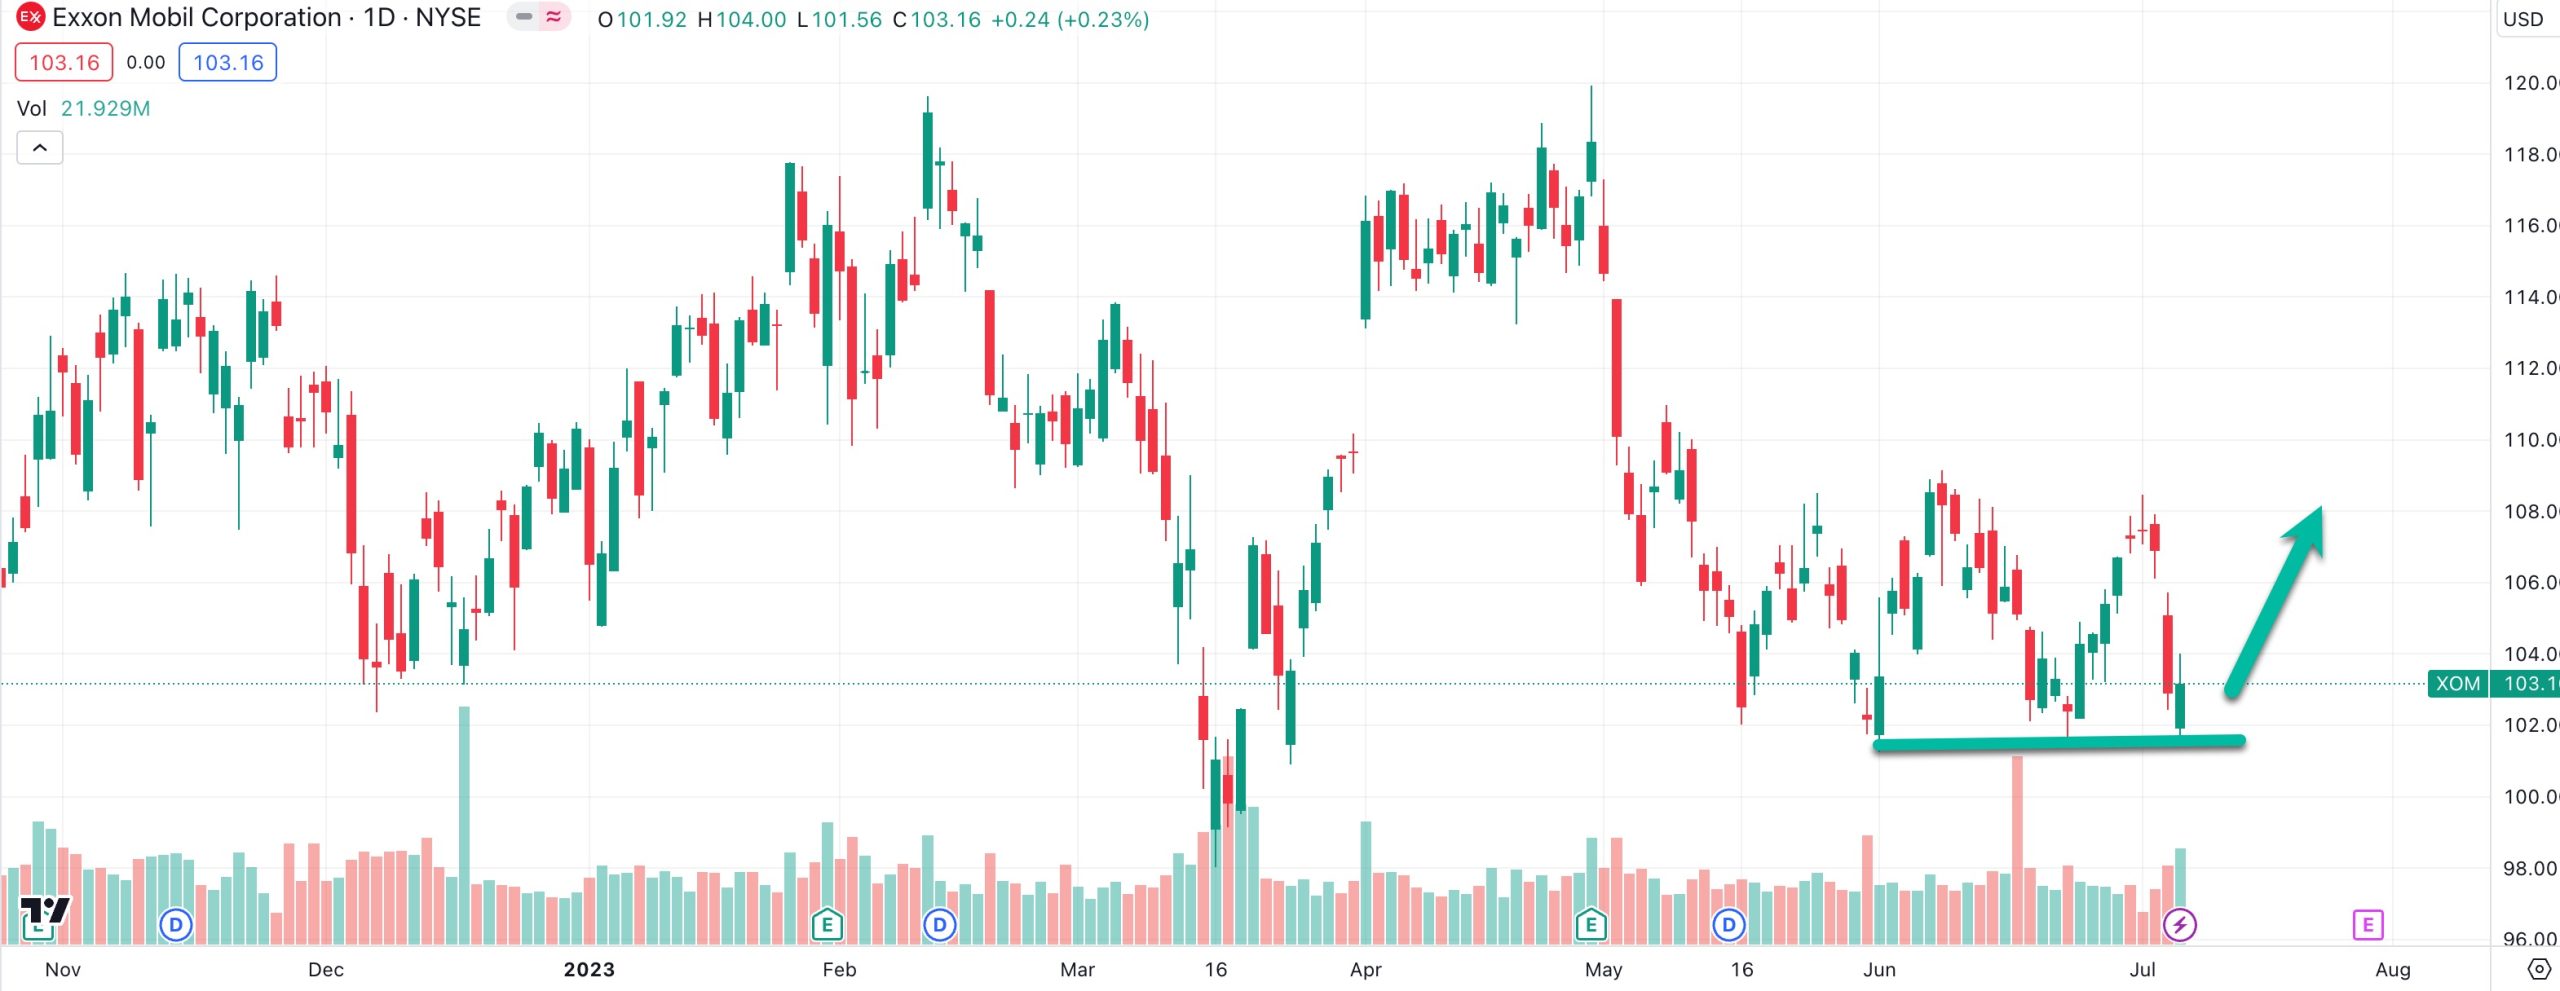
Last Friday, crude oil had a big bounce yet bellwether Exxon failed to follow with as much conviction. It’s sitting near support and has the potential to play catch up.
Bullish options flows would suggest $110 could be the next stop on the horizon for Exxon. A break below $101 would invalidate the thesis.
Another play that has been working well for months is to ride the wave of a Stanley Druckenmiller favorite, Datadog.
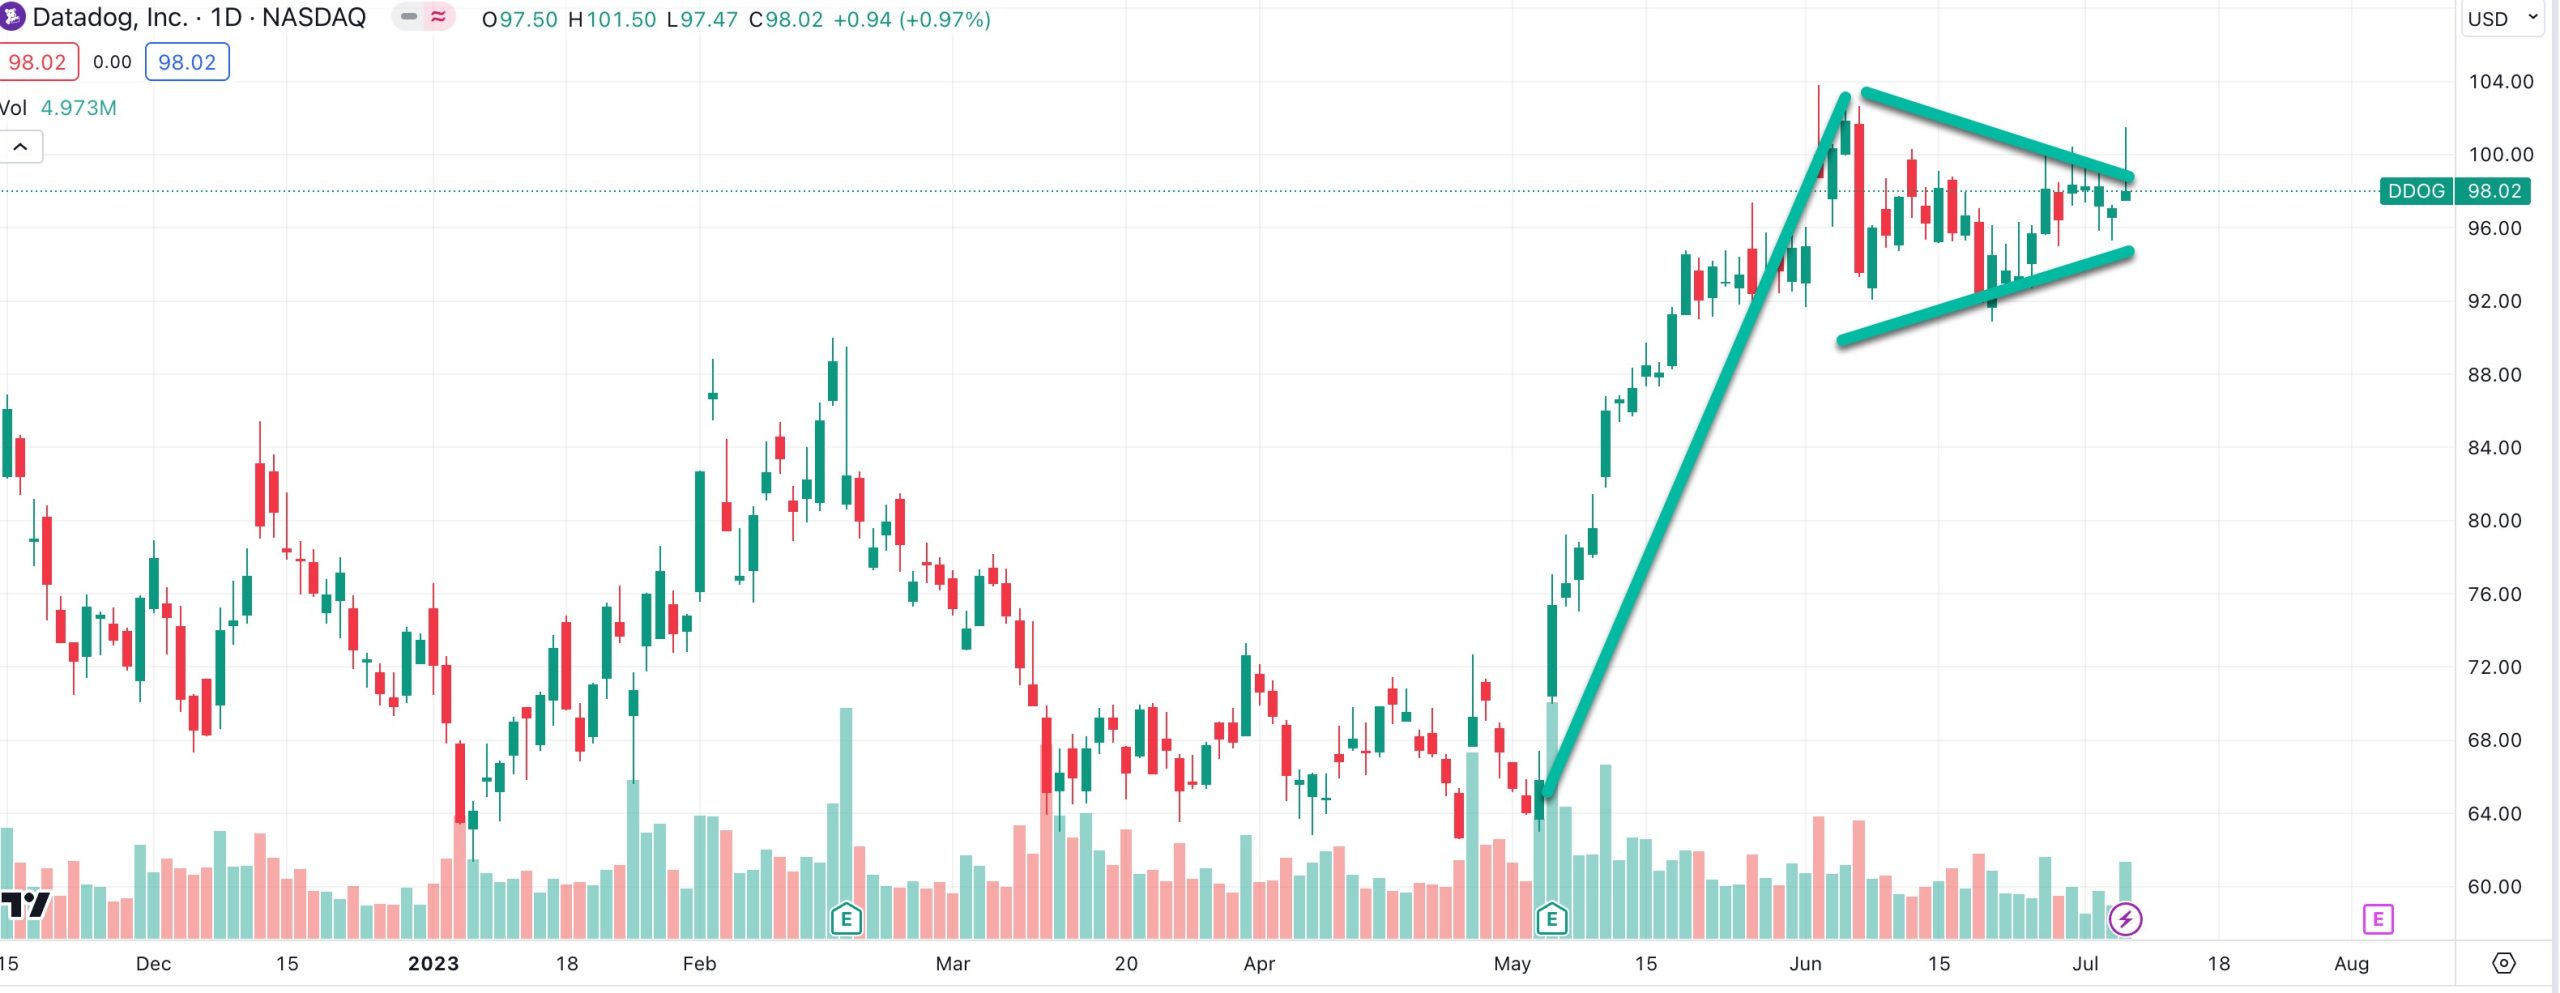
The share price has been somewhat volatile, falling to the $60s and rising to $100+ in recent months but it could be on the verge of a bullish breakout.
For those that don’t like to gamble on the stock going higher, the calls have been offering 3-4% monthly for many, many months. A close above $100 would be a signal the bull flag pattern has been broken and the stock could be off to the races.
On the whole, it’s time to be cautious because oscillator divergences with price are evident now in the major market averages, particularly the S&P 500. At the very least, when the S&P 500 is near the top of a rising channel it’s not the time to get aggressive with positioning.


