Market Commentary: When To Sell Your Stock, Precisely
Buying stocks is easy but when should you sell them? Today we’ll take a look at a specific example of precisely when to take profits, and move to the next best trading idea.
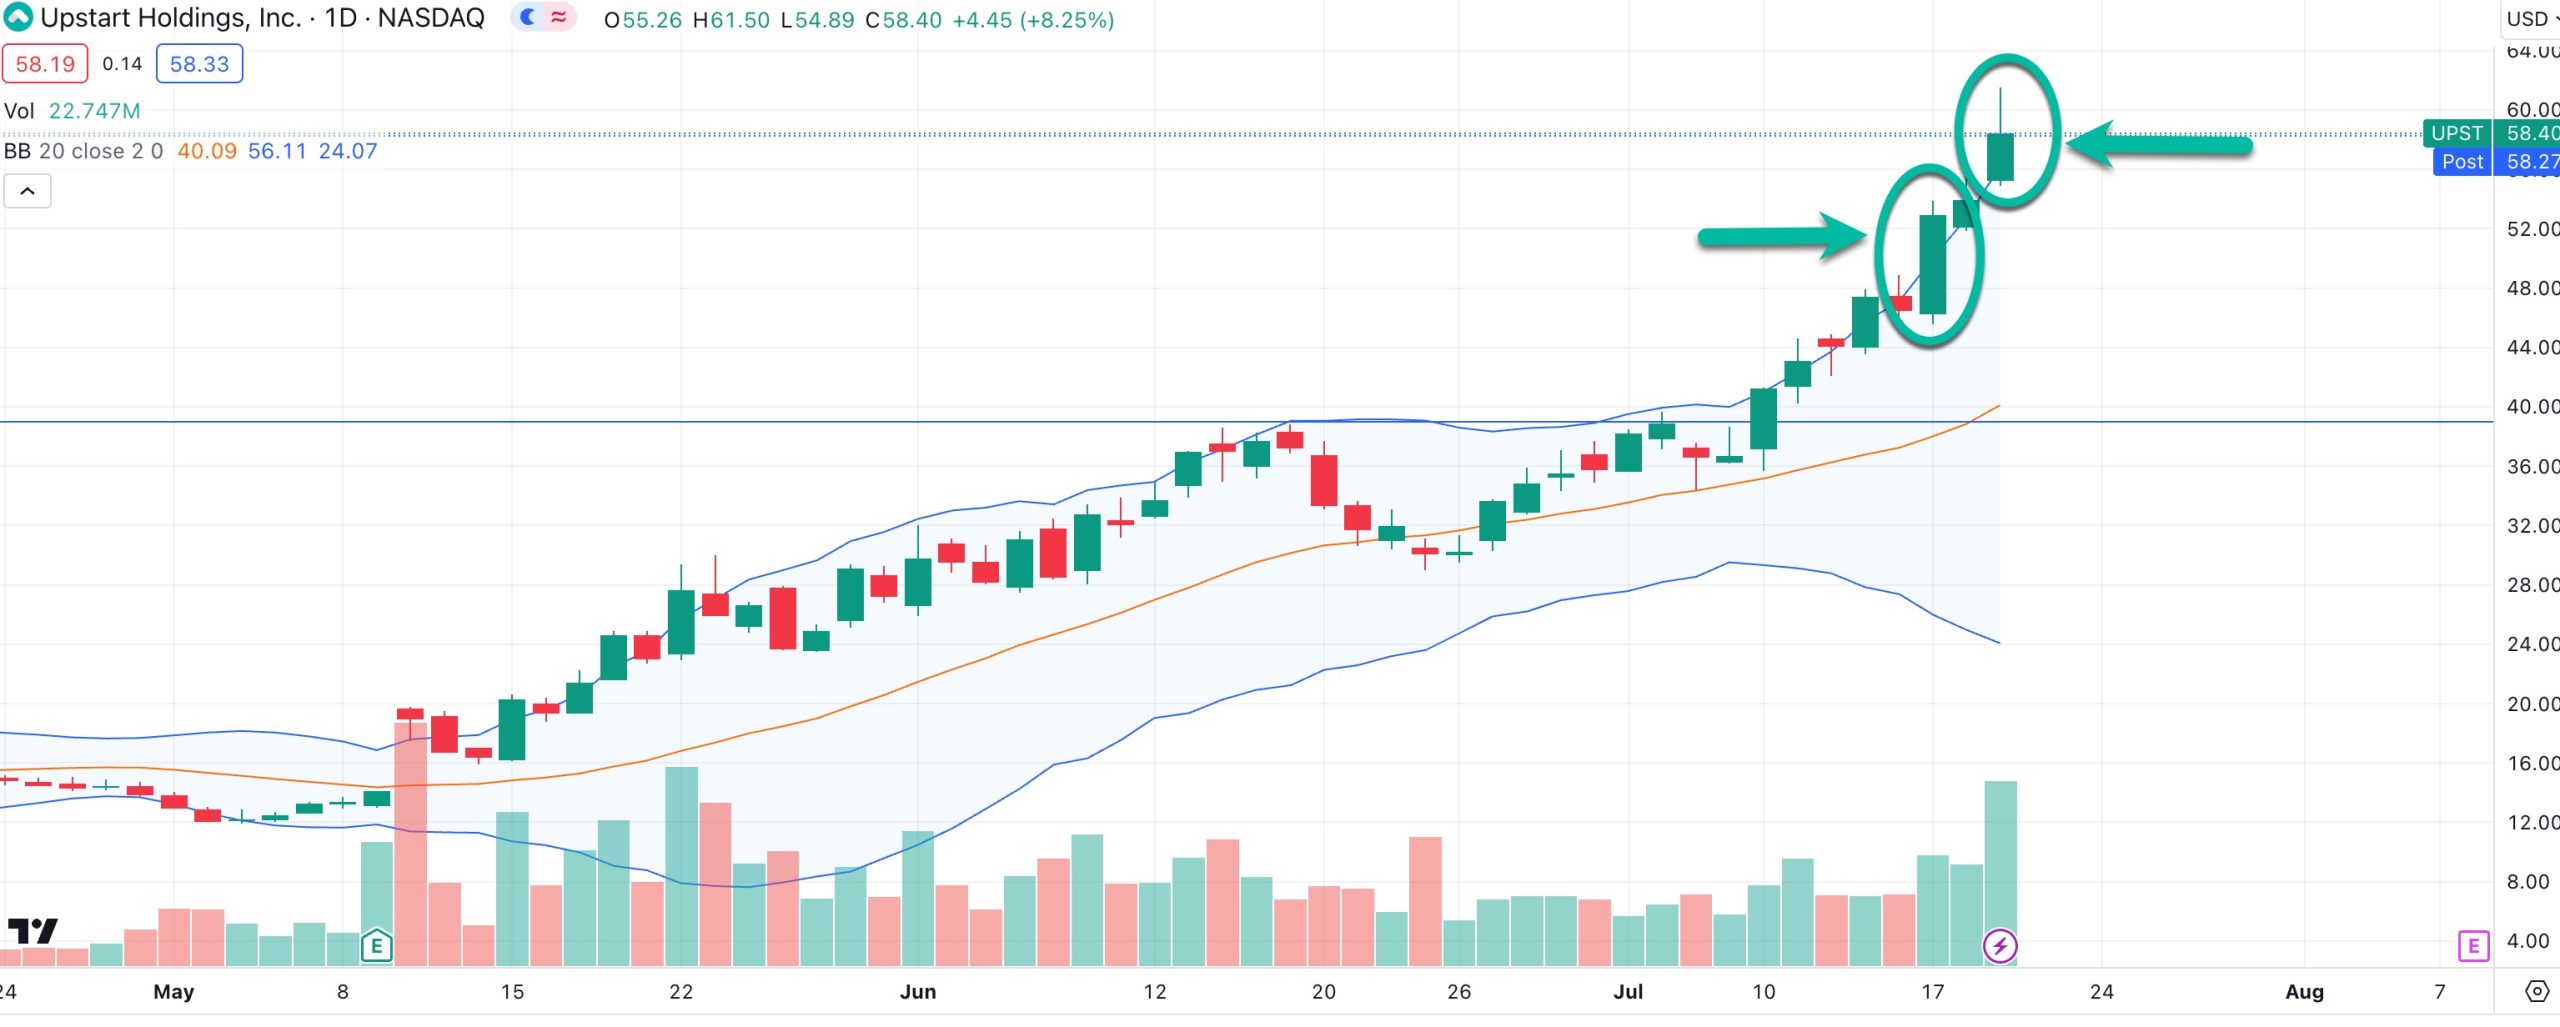
We’re going to use Upstart for our case study. In the chart below, you can see Upstart was in a a bullish trend since early May. But it wasn’t until July that the share price started to hug its upper Bollinger Band in earnest and the angle of ascent moved sharply higher. That’s the sign a move may be coming to an end but some further confirmation is needed.
On July 17, the first real sign that the share price was extended appeared when it closed far above its upper Bollinger Band. Keep in mind 95% of price action occurs within the Bollinger Bands, so a breach is a rare event and should be treated with respect. It doesn’t mean the move is over, just that it lies within the 5% of price behaviors.
That pop wasn’t the sign to exit, though. Instead, bulls could cling on for another few days until July 19, which is when a pattern that mimicked a shooting star took place.
It wasn’t a perfect shooting star – ideally the close would have been weaker – but certainly the share price clipped a multi-month high and rapidly reversed to close weaker. When euphoria has set in following a parabolic move followed by an intra-day reversal, you can look to exit and take a wait-and-see approach.
How To Trade The Pattern
The best strategy here is to simply watch from the sidelines or simply pare back a full position and take partial profits. The trend is unequivocally still bullish so the odds of it continuing higher are good. It’s simply that the share price might need to rest for a few days to let the moving averages catch up with it. From your perspective, why wait?
Better to sell the peak of euphoria, and watch for the pullback as the stock gathers steam to make a new assault on higher highs than to ride the pullback too. Of course this requires a deft touch to dive in and out at the optimal moments, so you would need to be watching the daily closes to capture the most profits.
If that’s too much of a time commitment, skip past the daily charts and look to similar behavior on weekly charts. The same principles apply on different time frames.


