Market Commentary: Little-Known Indicator Forecasts Market Plunge
Some indicators aren’t well known or understood but can be highly effective when used by proficient traders. SKEW is one such indicator; it measures the perceived tail risk of the distribution of S&P 500 investment returns over a 30-day horizon.
The rule of thumb is when SKEW rises above 140, the risk of a market correction is elevated. But when combined with other indicators, it can be even more useful.
Key Points
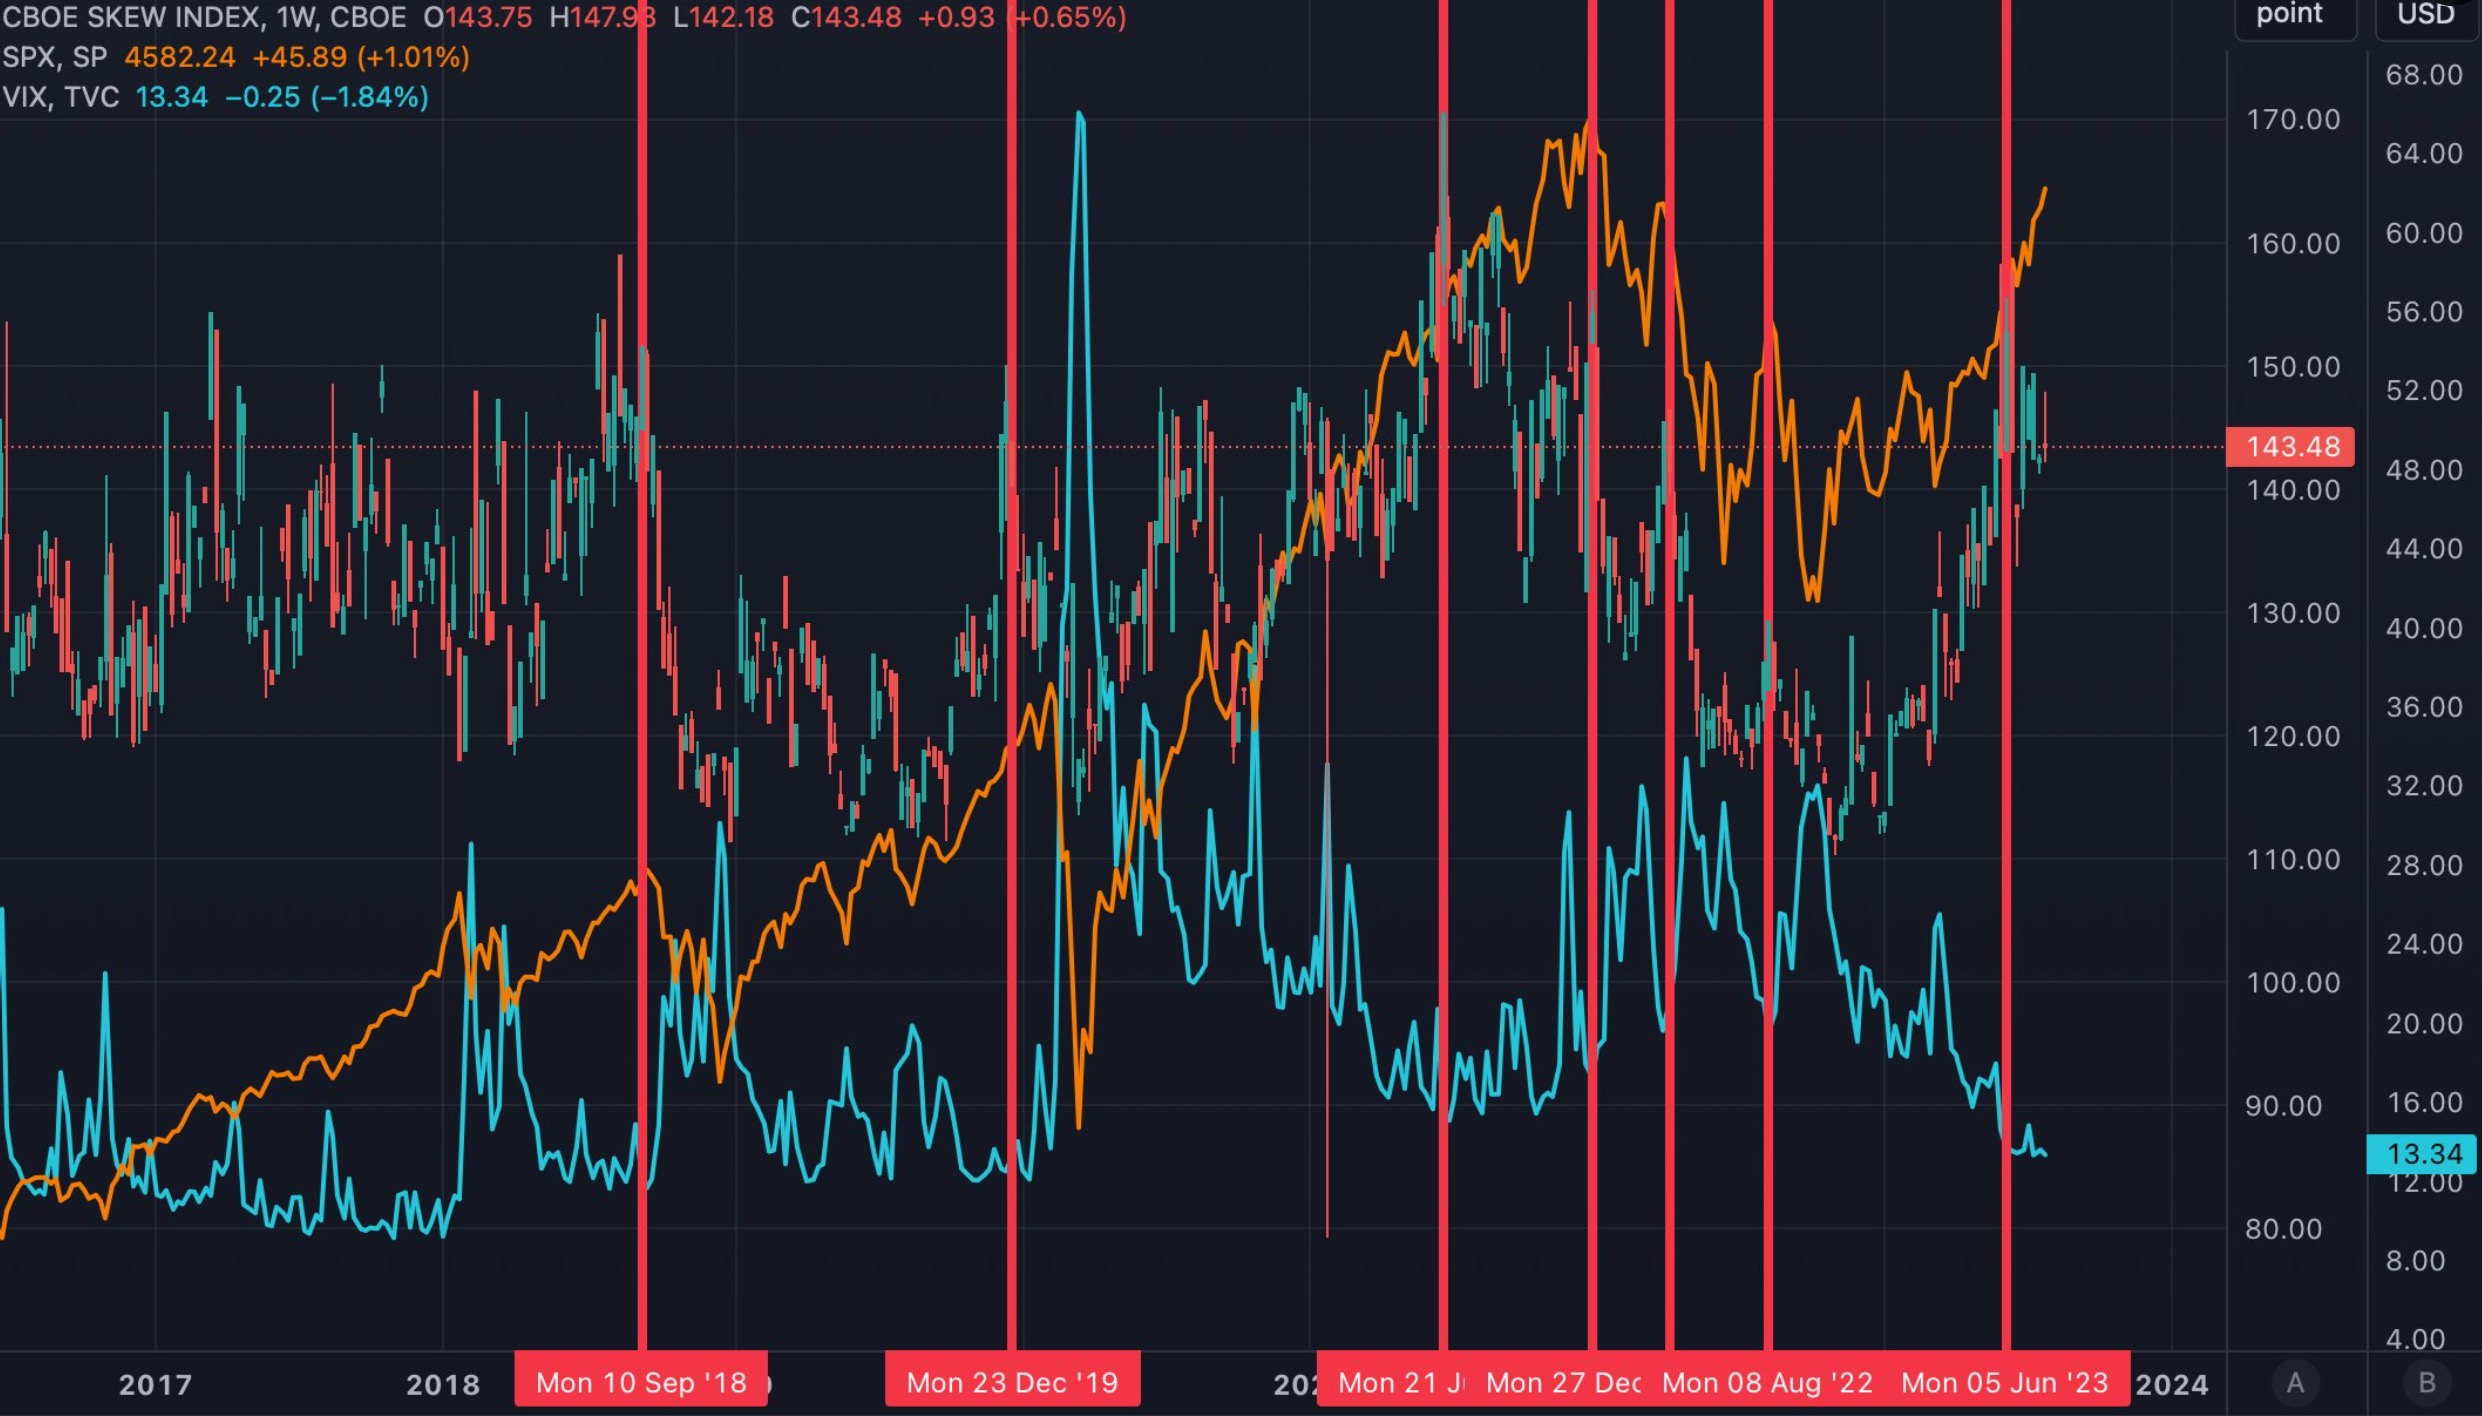
- SKEW has a correlation with VIX, where VIX hitting lows and SKEW hitting peaks often precede market corrections.
- When SKEW falls rapidly, the market tops more quickly and when SKEW falls more slowly corrections historically took longer to form.
- When SKEW begins to decline, the risk of a market correction rises.
Boost Results Via SKEW?
A correlation appears to exist between VIX hitting lows and SKEW hitting peaks, historically. Generally, a correlation has occurred where the market topped shortly after a SKEW peak and VIX low occurred.
When the SKEW falls rapidly, the market tops more quickly and when the SKEW falls more slowly the correction took a little longer to form.
Chart Credit: eliant_capital
Currently, we see the SKEW is elevated and the markets have a strong bid under them. After monthly options expiration, a window of weakness appears when the nature of the options market lends itself to fewer flows supporting stock prices. Yet in the June and July windows, the market remained strong, above its 20-day moving average, suggesting a strong underlying bid.
Key Notes
When we look back to 2021, SKEW fell for most of the year while the market was falling. This is a fascinating correlation to keep a close eye on if you’re trying to spot when capitulation will occur and the market trapdoor will open for more downside movement.
Here’s the key: if you see SKEW going up, that’s exactly the opposite of what you need to see for a downside movement to occur. You need SKEW to fall to signal some potential downside is on the horizon, according to the correlations we have seen.
When SKEW Falls, Watch Out
The key takeaway is that when SKEW begins to decline, the risk of a market correction rises. Until then, traders are hedged and positioned for downside risk but supportive flows are counterbalancing the hedging.
If you’re looking for the prime windows of opportunity when weakness may occur, mark your calendar for the few days leading up to monthly options expiration, and the week thereafter.
If the market can hold its 20-day moving average during that time period, the odds are the next 3 weeks will be flat to up. However, a break below the 20-day moving average during that window would suggest a more pronounced correction is coming.


