Technical Signals Scream SELL
Correlation and causation can easily be mixed up when trading. Just because markets fall every time something happens doesn’t mean that something is the cause. Nevertheless, when correlations appear, they should be respected, and we just stumbled upon one that, if true, screams it’s time to SELL.
Scary Technical Trend
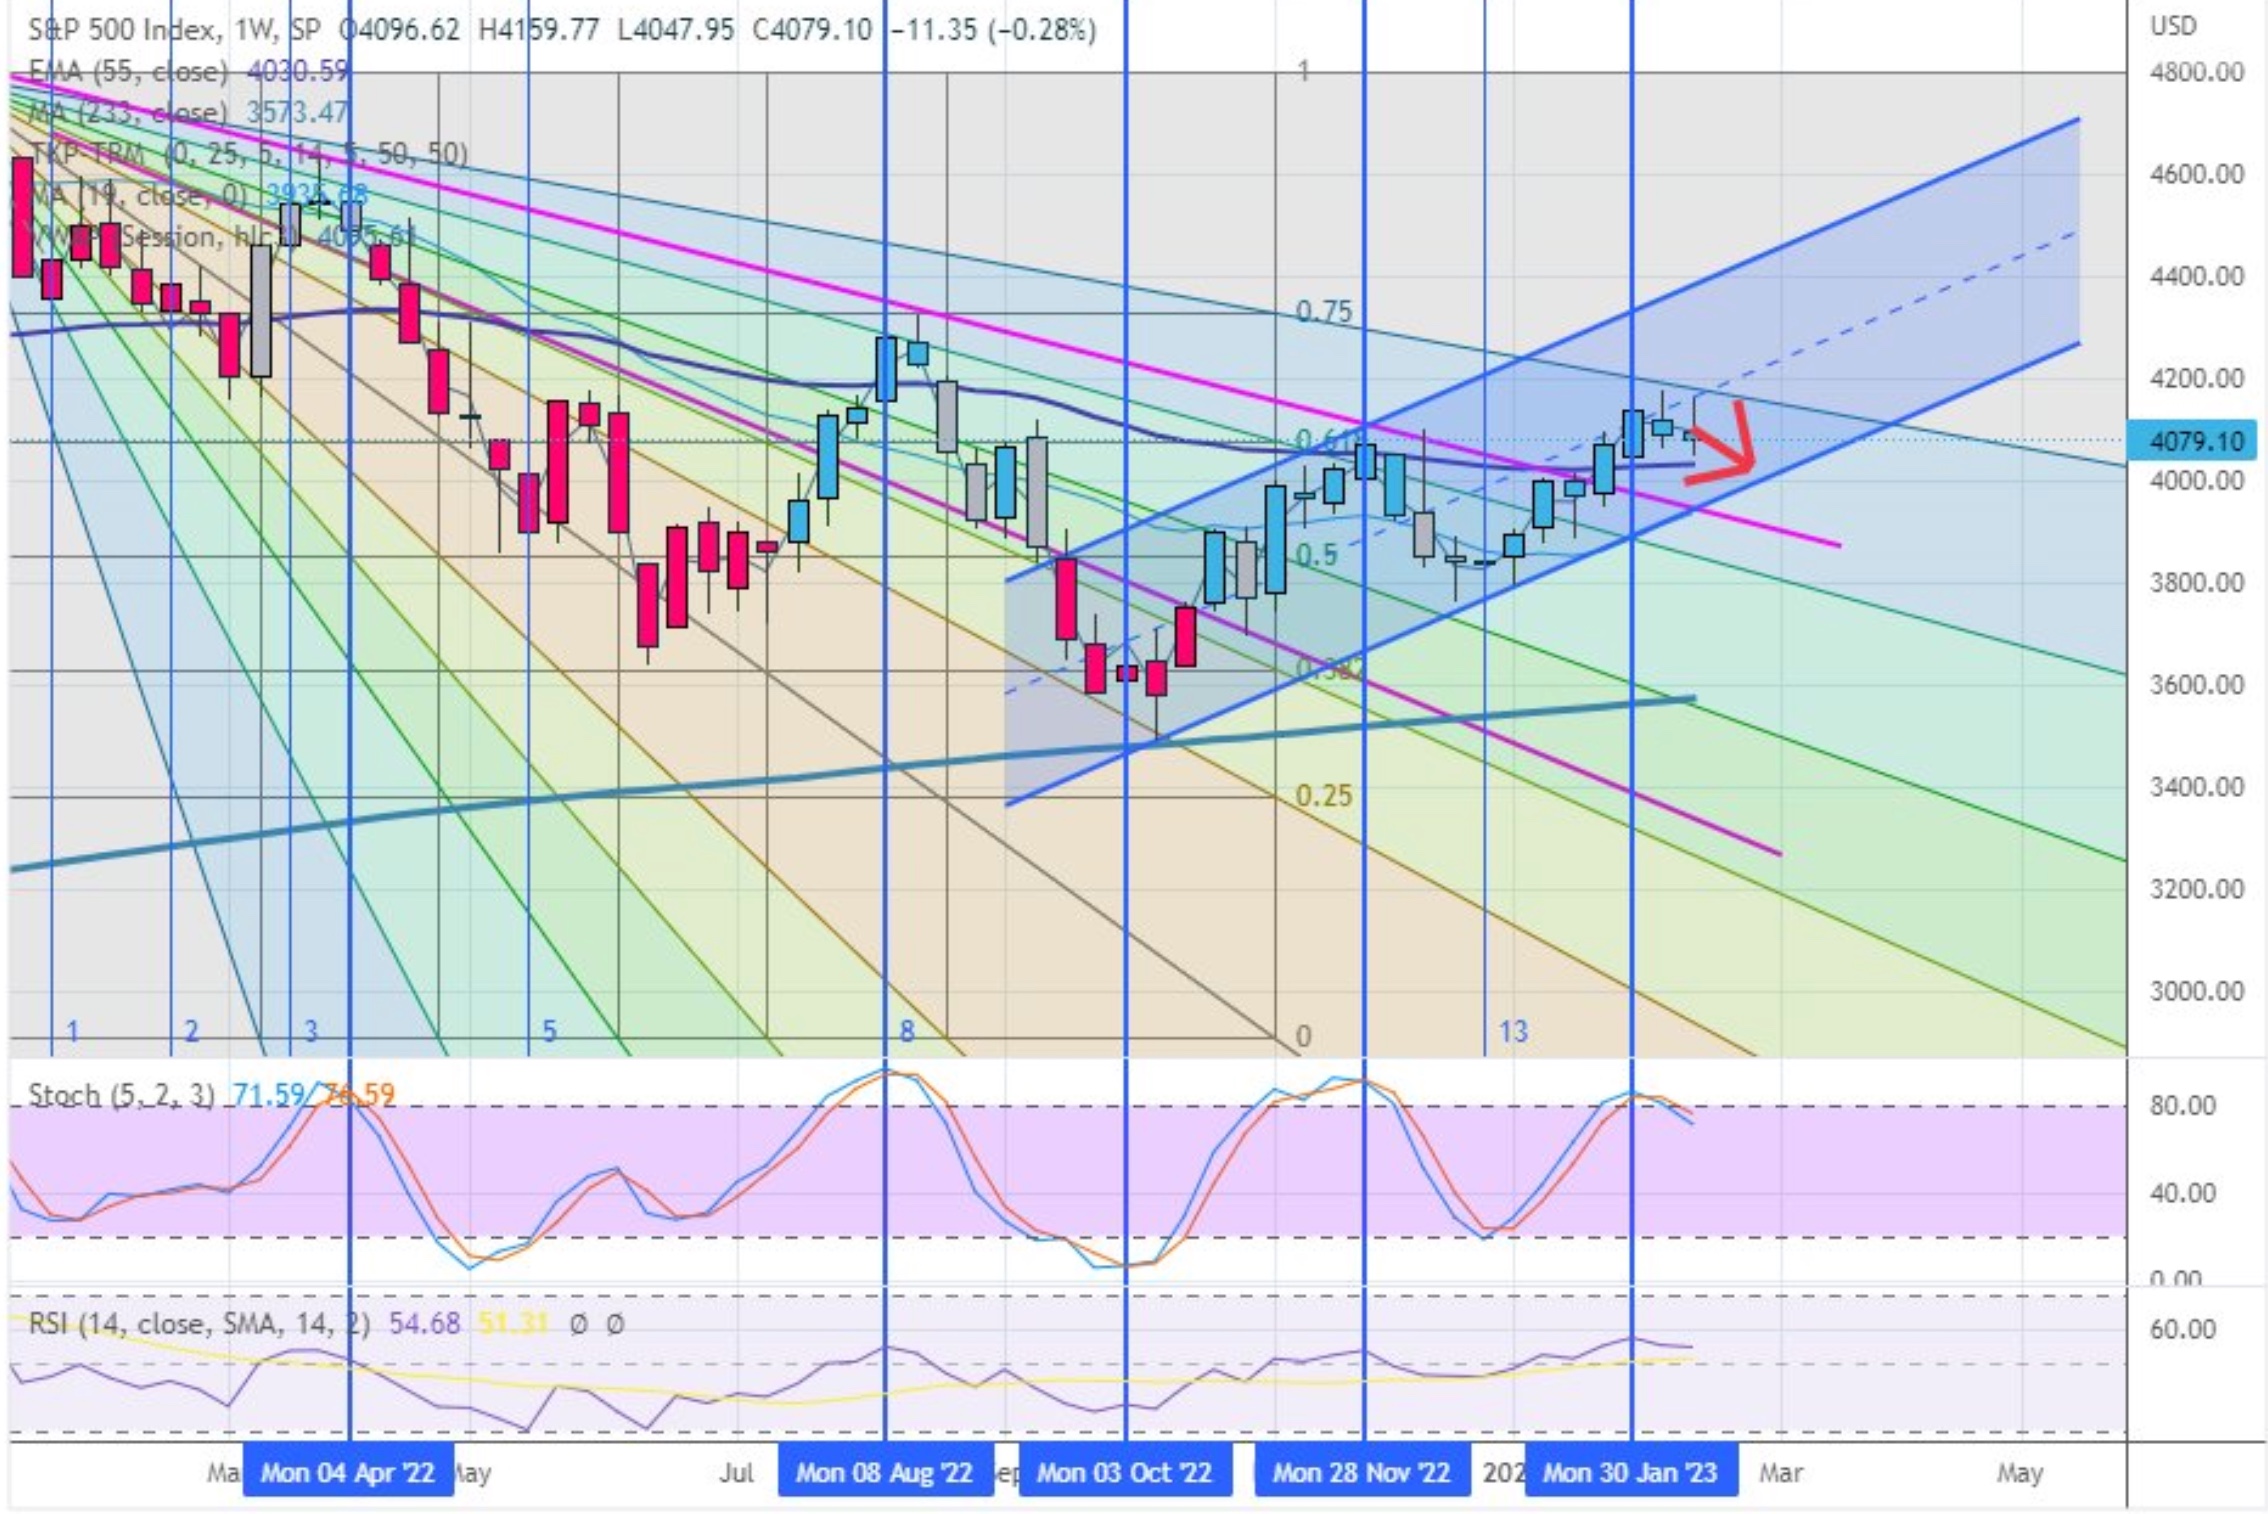
Over the past year or so, the market has generally been trending lower. A series of lower lows and lower highs were evident coming into 2023. Within the broader downtrend, it became apparent that the market had cycles of highs and lows. The primary cycle tops took place around April 4, 2022, August 8 2022 and November 28, 2022 when a technical trigger flashed.
Interestingly, a weekly chart of the S&P 500 reveals that it has recently flashed one more time, on Jan 30, 2023. Since then, the market has not had a higher weekly close. Moreover, the market has shown signs of weakness over the past few trading days. Bulls have clung onto the resilience of the market towards the end of trading hours but make no mistake about it, the action over the past 3 trading days has not been positive.
As you can see in the chart below, the stochastics topped out in overbought territory on each of the dates above and again a few weeks ago. On previous occasions, you will see the market didn’t take long to fall over. Most recently, it has held firm a little longer but continues to show signs of weakness.
Credit: @ShortSellerST
How Long Will Market Decline Last?
Obviously, there’s no guarantee the market will fall as it did previously when this technical trigger flashed. But if it does, how long could a downtrend last? And perhaps more importantly, how low could markets go?
Back in April, the high-t0-low trajectory was close to 1,000 points whereas post-August trigger, the decline was limited to about 600 points and in November it was closer to 200 points before a meaningful bounce took place. That might suggest the market is losing steam on its downtrend and has more underlying strength supporting it.
Technicals aside, we can turn to a fair value calculation for the S&P 500 using earnings, growth, cash flows, 10-year Treasury rates and a discount rate to arrive at a fair value for the market now closer to 3,500.
The market tends to oscillate well above and below fair value on any given day but usually converges on it almost magnetically over the long-term. So can markets fall another 500 points? History says they will mean revert towards 3,500 at some point in the medium-term, but whether that’s around the corner remains to be seen.
At the very least the bearish technical signals overlaid with the lower fair value of the S&P 500 says it’s time to respect the markets, and not be too brazen in allocating capital. We’ve seen already how Buffett’s sell-to-buy ratio vastly favored selling recently. That should provide a hint at least that all is not rosy under the hood, even if prices would infer it to be the case.


