
End Of Bull Cycle Is Near With Expensive Market And Divergences In Market Breadth
Kris Hoobaer
Editor’s note: Seeking Alpha is proud to welcome Hugo Ferrer as a new contributing analyst. You can become one too! Share your best investment idea by submitting your article for review to our editors. Get published, earn money, and unlock exclusive SA Premium access. Click here to find out more »
This has been an extraordinarily expensive market for some time now. No longer compared to times long gone, but even compared to the range of valuations observed over the last 3 decades.
Thus, the P/E ratio of the S&P 500 Index (SP500) using estimated earnings for the next 12 months is at 20.47x, a level that has only been touched at the end of the technology bubble between 1998 and 2000 and during the explosive stock market rally that occurred during the pandemic, in the heat of the enormous monetary and fiscal stimuli launched by the competent authorities. As we all know, those excessive valuations were followed by bear markets, including the great bear market between 2000 and 2002 when the S&P 500 lost half its value.
P/E ratio of the S&P 500 index with 12-month earnings estimates (FactSet)
Now, a very expensive market is not a selling signal per se. Rather, it is a high-risk factor, just as a 93-year-old has a higher probability of dying tomorrow compared to a youngster as young as 15 years old. If we use this analogy, this market is like an elderly gentleman over 90: no one knows when he will die, but the statistics are against him, and it would be extraordinarily rare for him to live beyond 105 years.
What is more worrisome, beyond this more or less abstract risk factor, is that intermarket signs have begun to appear that this bull market born in October 2022 is in its final phase. You know, technically the bull market was born in 2022 because previously the S&P 500 index had declined more than -20% from all-time highs, but also many of us argue that that was just one more stop in the great bull market that was born in March 2009, when in the midst of the Great Recession many doubted the capitalist system.
And what are these signs that concern me and that have historically occurred at the end of bull markets? Nothing less than significant divergences between what a few leading stocks are doing and the rest of the market. So while Nvidia (NVDA) and other leading stocks have rallied over the past 3 months, the rest of the market has lost market capitalization over the same period.
Change in market capitalization of leading stocks and the rest of the market (Financial Times)
This is a classic sign of an adverse macroeconomic environment, where only a few stocks that do not depend so much on the general economic cycle can shine, while the rest of the market fails to take flight.
And the reality is that when faced with these adverse macroeconomic conditions and the market as a whole suffers, it has historically been a classic sign of the end of the cycle. Jerome Powell may continue to celebrate the so-called soft landing, a situation where the economy continues to grow and unemployment does not pick up significantly despite official interest rate hikes, but market breadth is signaling that the current environment is adverse and that the danger is at its highest.
In other words, a market that is extraordinarily expensive and showing significant divergence in market breadth is a ticking time bomb. Personally, I am still bullish on this market, but I recognize that I am ready to exit my positions and even open shorts in the main indexes if I detect an interesting point from which to do so.
Historical divergences between an S&P 500 index making new all-time highs while its own market breadth gives bearish signals. (Sentiment Trader)
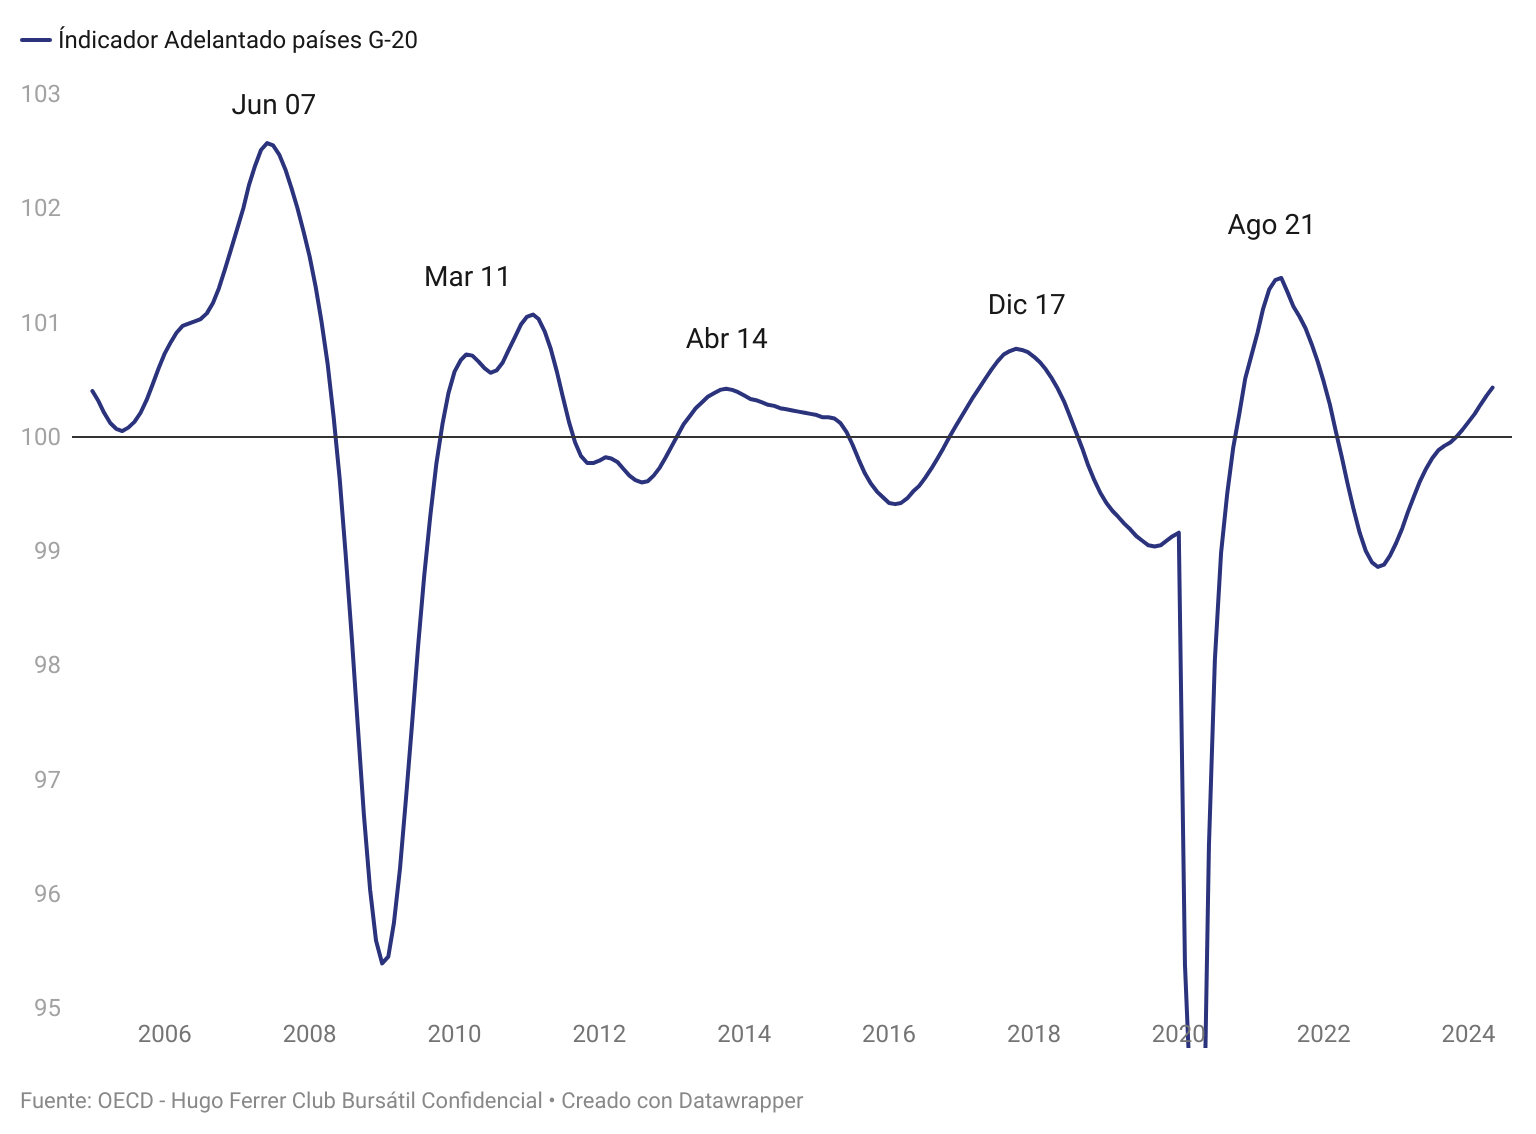
From my analytical scheme, only 2 things would be missing for me to become bearish and position myself accordingly in this market. First, for the OECD leading indicator to turn downwards, something it has not yet done, but could be close because some already published components of this aggregate indicator have cooled recently. This indicator, designed specifically to detect different trends in the global business cycle (I use the data for 20 OECD member countries that the OECD itself calls the G20), is a good guide to understanding whether the global economy is accelerating or decelerating.
Not that it has the ability to predict a recession, but it does tell you whether that global economy has entered an economic slowdown. And let’s remember that, one, global economic slowdowns sit very adversely on the stock market and, two, that every recession always starts as an economic slowdown. In other words, if you see the OECD indicator declining, my best advice is to stop being bullish on the stock market.
OECD Leading Indicator for the G20 group of countries (OECD)
If this turnaround were to occur, and the analysis of macro data already published seems to point in that direction, then I would turn bearish and look for bearish positions in the market.
Of course, knowing that this is a very overvalued market, when the time comes I would go for its weaker parts. I would not go short the NASDAQ-100 Index (NDX) or the S&P 500 index, but would go short the equal-weighted versions of the S&P 500 index, such as the Invesco S&P 500® Equal Weight ETF (NYSEARCA:RSP) or through a small-cap ETF such as iShares Russell 2000 ETF (NYSEARCA:IWM), as these are the weakest parts of the market right now and the ones that would allow for a better risk/reward ratio if and when the time comes.
That said, I remain bullish, but like my finger on the trigger to fire if things play out as I have outlined here.