
How Strong Or Weak Is The Economy?
hometowncd/E+ via Getty Images
I have collected 53 monthly frequency indicators, a mixed bunch set in various economic categories, including some diffusion indicators. I rank diffusion indicators based on their levels, I do the same with the unemployment rate and I/S ratio. For the other variables that are from conventional economic statistics like industrial production, retail sales, jobs, etc. I rank the variables based on their 12-month growth rates, calculated over the past nine years of data. After developing rankings, I convert them to percentile standings so that 100% is strong and 0% is weak. The chart (and table) below presents these data in their percentile format. The data are grouped in various familiar economic categories (non-overlapping) to track and assess various segments of the economy. The Data – their rankings – confirm that the economy is mostly weak. Data are drawn from a period of nine years long, but if I extend it back 14 years, the same general results are established. And if I rank indicators on six-month growth rates, the same general conclusions apply.
Average Indicator ranking by Category (Haver Analytics, FAO Economic)
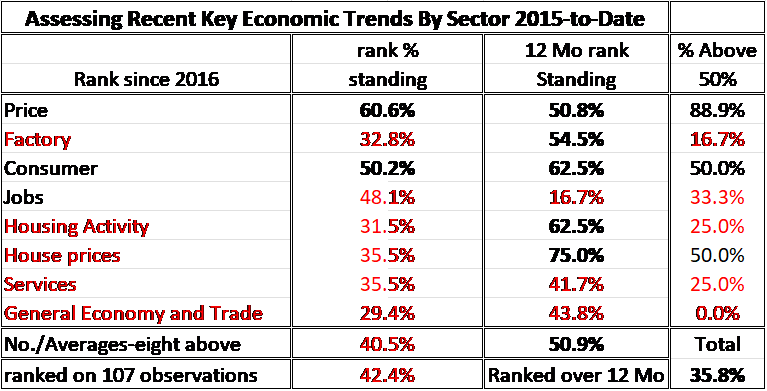
Over nine years, the average percentile ranking of the data is a 42nd percentile standing. This compares to the median of each series, which for ranked data will always fall at the 50th percentile. So the average response is below its median for the period. Only prices and consumer data are at or above their medians on this timeline (for diffusion levels or year-on-year growth rates).
The general economy and trade have the weakest standing, in its 29th percentile, but the factory sector, housing activity, housing prices, and services also rank low, in the same vicinity.
Jobs rank higher, in their 48th percentile, close to their historic median.
The salient signal here is that these various sectors are running well below their historic median performance, generally.
Of course, be careful what you rank. While house prices expressed as annual growth rates rank in their 35th-percentile, house prices (new and existing) rank in their 85th and 91st-percentiles when ranked as price levels. House prices are high, as we know, but their recent momentum is weak.
As an added metric, I rank each component and each sector over the last 12 months, also expressed as a percentile standing to capture near-term momentum. Here the results are more promising as we see the rankings show an average standing at its 50.9 percentile. Five sectors score readings above their 50th percentile. But jobs are extremely weak-near term, and the general economy and trade category plus services are below their respective medians.
A final column in the table shows that only 35.8 percentile of the 53 categories are above a 50-percentile standing. The general economy and trade metrics are the worst, followed by factory data, housing, and services. Only price data are substantially (88% of them) above their respective medians.
Nine-year Rankings of Eco-time series
Indicator rankings (Haver Analytics; FAO Economics)
About these rankings: A ranking of 32.8% means that the variables in that section have an average ranking of 32.8% which means the individual rankings have been this high or lower 32.8% of the time (the variable in this case is near the upper boundary of the lower one third of its ordered queue of data). Only two data sections in the table have rank standings above 50%, above their respective medians.
All of this sounds bad. But at the same time, the Atlanta Fed GDP-Now assessment is looking at a 3.3% gain for Real GDP in Q2 of 2024. That would be a quite strong reading for GDP. One significant reason for this is the absence in the table above of any data tracking the government and its spending that has been enormous in this cycle.
The Atlanta Fed result combined with the data in the table complete the picture of the US economy as defying any sort of precise analysis.
The economy simply has many contradictions. And while inflation remains high and has previously decelerated, it is now locked in a minor uptrend that we do not know much about. Will this new inflation acceleration continue, or will inflation remain steady, and rejoin the downtrend?
In the wake of Covid, I’m sure the Fed distrusts what its own models say since the economy has changed so much post-Covid. In any event, before Covid, the Fed’s models were not doing such a great job.
The Church of What’s Happening Now
We cannot say anything about the economy with authority-and it has been that way for a while, despite the Fed’s failure to recognize or admit this. But this condition is a good reason for the Fed to give us less guidance and to key its decisions more off ‘the data’ (genuflect). The reason for this is two-fold (1) models are not working well, so we do not know the future with any strong conviction and (2) we are not even sure exactly where the economy currently is – how strong it is- and what the risks are. Time to be humble and less ambitions with policy.
Pre-Covid we were in a strange place with intense global competition, contained prices pressures, low -below inflation interest rates – and steady if unimpressive growth. We had a long stretch of price stability before the Great Recession and after. The ‘After portion’ had little to do with monetary policy excellence. But the Fed wants to take credit for it. Many market players consider this period a ‘new realty’ and think if things are left alone we are going back there. But there is no evidence that eco-gravity will take us back to 2%. The Post-Covid world is different. The right policy for the Fed in this conundrum is to make policy one-day-at-a-time. It is not clear that the Fed can do that. It is too prone to meddle and to overreach its ability by positing a future it really does not know. That remains a big risk.