Did The Market Already Bottom?
If Goldman Sachs is right, the market moves late last week were sufficient to alleviate selling pressure, at least for now. They identified a key line in the sand around 5250 where selling pressure would sharply drop over the coming week from the sell orders that had been slated.
It’s also been a tailwind to see big institutions, from hedge funds to corporation buying the weakness last week. Even when prices were on the rise last Thursday, the buying continued.
Key lines in the sand, such as benchmark moving average levels, were also eclipsed. And when the market closed, no major imbalances were left lingering to suggest an impeding correction.
Add to these bullish tailwinds the improving sentiment indicators that had hit extreme fear earlier in the week and you end up with a more rosy outlook for the week.
So, is the bottom in?
Key Points
- Recent market moves may have reduced selling pressure, with key levels holding and institutional buying boosting optimism.
- Bulls cite strong fundamentals, while bears warn of continued seasonal weakness that extend in election years.
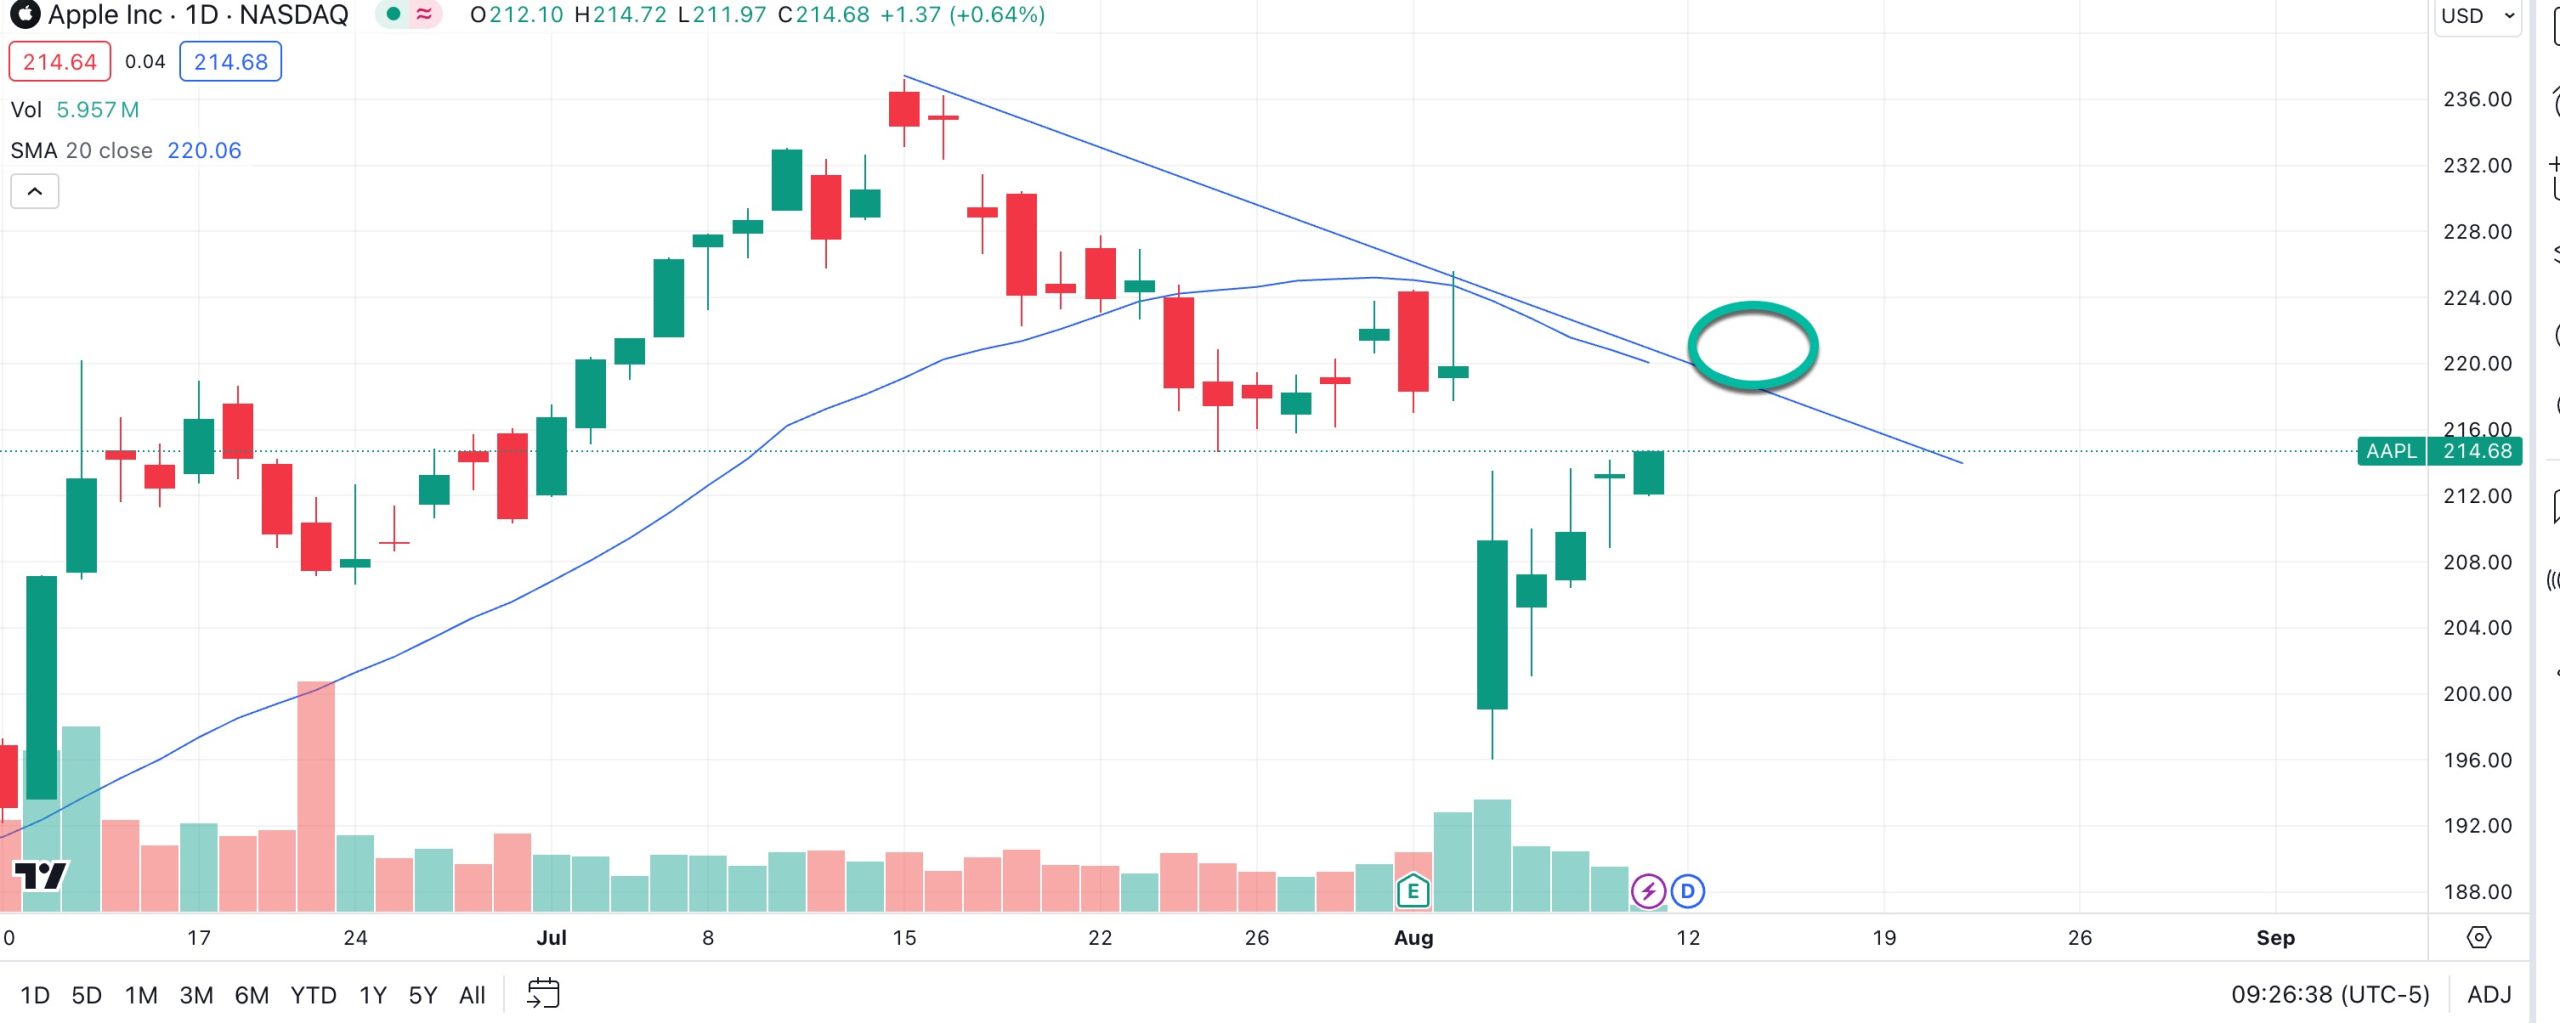
- The chart of Apple now tells you all you need to know about how to trade the stock market.
The Bullish View
The bulls can argue that nervous sellers panicked over concerns last week that the Japanese carry trade – borrowing cheap yen and investing in higher yielding US dollars – would unwind.
Seasonally, the can point to weakness around the August time window too. It’s not uncommon to see a jittery market at this time of year when seasonally it’s weak, particularly given that pullbacks of the same magnitude often happen a few times annually.
They also point to fundamentals holding up well. The ISM Manufacturing Index and Nonfarm Payrolls data suggest that the underlying fundamentals are pretty solid. For example, the latest Nonfarm Payrolls report showed 114,000 jobs added, right in in line with historical norms.
With the majority of S&P 500 companies having reported also, profit margins are about 50 basis points above their 5-year average.
The Bearish View
For the bears, there are arguments to support their claims that we’re not out of the woods yet. That same seasonal weakness referred to above doesn’t end in August but continues into September, suggesting there is more downside risk on the horizon.
In fact, during Presidential election years, negative seasonality often runs all the way into October due to uncertainties around new administration policies.
There is also the fact that Goldman Sachs suggested the momentum trades that had led the market are largely in the rearview mirror and, if anything, deserve to be hedged.
It wasn’t all gloom and doom from them though. They also commented that “From here, it’s choppy but higher” so if they’re right the dip can be bought but a few wobbles may be expected. On the other hand, you have some top traders sitting the volatility out in cash until a clearer picture emerges, so how should navigate the uncertainty?
What Should You Do?
Listening to the bulls or the bears can be a losing bet. Instead, following the trend and the price action is usually the best bet. Take Apple as an example now.
Should you buy or sell it? If you look to the chart you will see the bounce recently following the selloff.
The trend is still down and until it breaks back above that resistance level, the price action says wait to buy until it proves to you that the old resistance has become new support.


